admin
No description.Please update your profile.
Best Microsoft MCTS Certification, Microsoft MCITP Training at certkingdom.com
See your computer’s key operations at a glance
Computerworld – It’s been nearly two years since Windows 7 was released, and yet there are still some features that Windows 7 users may not be taking full advantage of — such as desktop gadgets. Similar to the Mac’s Dashboard Widgets, Windows desktop gadgets are mini-applications that reside on your desktop and can display live data, perform simple functions like search or password generation, or give you a sneak peek inside the inner workings of your PC.
Each new Windows 7 system ships with a handful of gadgets that show dynamic data such as the time, the weather and current news headlines, but there are more than 5,000 gadgets available that run the gamut from the frivolous to the essential. A few come from Microsoft, but the vast majority were written by third-party developers, and most work with both Windows 7 and Vista. All are available for download at Microsoft’s Windows Live Gallery.

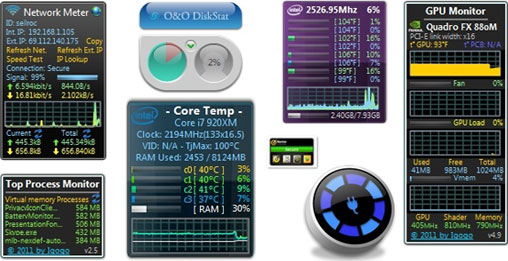
An array of system-monitoring gadgets.
There are gadgets for gaming, monitoring online auctions, keeping up with email or social media, playing music, encrypting files and even showing the phase of the moon. More important, though, gadgets can be extremely useful for system monitoring.
In the following pages, I’ve gathered a dozen handy gadgets that display data about key computer operations: networking, system resources, component status, battery level and more.
While these gadgets sometimes duplicate functions provided by built-in Windows tools, what sets them apart is that they’re always on the desktop in easy view. Together, they provide a wealth of information about how your computer is operating in an at-a-glance format.
The best of them go a step further by linking to key system software. For instance, with the Network Meter gadget, it takes one click to refresh the PC’s IP address, saving the half-minute of clicking it normally takes to manually refresh the connection.
Like other Windows gadgets, these system monitors are small (from 26KB to around 2MB) and have a highly focused scope. Most take less than a minute to download and install and don’t adversely affect the system’s performance.
The best part is that they are all free for the download — a great way to add to your system without subtracting from your wallet.
System overview
With Windows 7 having something like 15GB of software code, figuring out what’s going on inside a PC is no easy task. The SysInfo and System Control A1 gadgets provide a valuable peek.
SysInfo
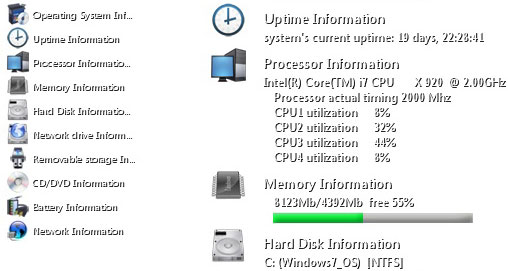
By default, SysInfo appears as a small icon that doesn’t show any data, but click on the icon and a huge panel displaying system information in a wide variety of categories pops up. On top of things like operating system details and the capacity utilization of the processor, there’s data on the computer’s drives, network connections and battery life.
SysInfo doesn’t provide all the details that more specialized gadgets like Network Monitor provide, but it’s an excellent overview, and there’s an uptime clock that shows how long it’s been since the system was started. You can choose to have SysInfo display all its info on the desktop or just in clickable category headers or the single icon, and you can adjust its size on the desktop.

Download SysInfo (265KB)
SysInfo gadget
The SysInfo gadget can display just headlines (left) or system data details (right) on your desktop.
System Control A1
In contrast, System Control A1 focuses on the essentials. In addition to a prominent digital clock that shows the current time (in a 12- or 24-hour format) as well as uptime, System Control presents a nifty bar graph showing how much memory the system has as well as its free memory available.
It also monitors the utilization of the processor’s threads (which it calls cores) over time and displays the results in graphs — useful information for those who push their systems to the limit.
Unfortunately, System Control’s display isn’t adjustable, and it can steal a lot of desktop area.
These two gadgets complement each other nicely: SysInfo does a good job of showing a snapshot of many of the current goings-on inside your system, while System Control A1 graphs processor utilization over time, which can be helpful in trying to trace a program that’s been using a lot of system resources.
Inspector Gadgets
One of these gadgets — or both — belongs on every PC.
Download System Control A1 (26KB)
Temperature gauge
Core Temp Gadget

There are few things worse for your computer than allowing its processor, often its most expensive part, to overheat and burn out. All it takes is one key transistor in the chip shorting out and the whole thing is an expensive piece of garbage.
ALCPU’s Core Temp Gadget can help keep your PC from getting hot under the collar. For it to work, you’ll also need to load the free Core Temp application, but the whole process takes just a couple of minutes.
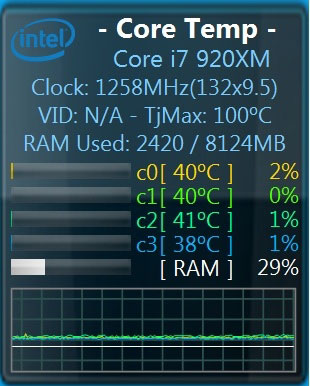
Version 2 of the Core Temp Gadget shows what processor your system has, its actual clock speed and how much of the system’s memory is being used. On many systems, it’ll also display the chip’s voltage, although some processors — mine included — don’t support this.
Core Temp gadget
Keep an eye on the temperature of your CPU’s cores with Core Temp.
The center of attention, however, is its temperature readings: Core Temp shows how hot it is inside your processor in surprising detail. The gadget displayed not only the temperature in each of my processor’s four cores, but graphed them in a line plot. It’s excellent information for trying to troubleshoot an intermittent overheating problem.
On top of adjusting the size of the gadget, you can change what information to show, the colors to use and how the graphs are set up. The gadget works with recent AMD and Intel processors, although some Phenom and Phenom II chips have a single temperature sensor and provide only one reading for the entire chip.
In the event that your system does start to overheat, Core Temp has your back. It will display “(!)” next to the temperature reading, open a pop-up warning and even start shutting the system down if you want it to.
Think of it as free insurance for your computer.
Download Core Temp Gadget (389KB)
Process watch
Top Process Monitor
Inside a PC there are thousands of individual software processes running, including those that interact with your computer’s CPU, RAM and hard drive. The fabric of a working computer is the sum of these processes.
The Top Process Monitor gadget acts as your PC’s greatest hits chart, showing which processes are using your computer’s resources the most. It can show the top processes for various operations including CPU use, memory use, virtual memory use, input-output operations and drive reads and writes.
You can also choose to view any individual process along with its usage data, or have the gadget cycle through any group of them. It’s the ultimate snoop to see what’s going on inside your computer.
On top of letting you adjust the size of the gadget, Version 2.5 of Top Process Monitor lets you choose which type of operations to display and customize the number of individual processes to show (up to 20) and the colors used.
A nice touch is that Top Process Monitor lets you set a threshold for the amount of system resources any process uses. If it’s exceeded, the software gives you a warning. It’s a great help if, for example, a sloppy program is using too much virtual memory.
Connection info
Network Meter
Having connectivity problems? The Network Meter gadget can help you keep an eye on your connections.
Network Meter gadget
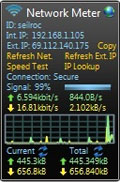
Network Meter takes the concept of “utility” to its natural conclusion. It’s chock-full of key networking data, including current upload and download speeds as well as total data moved. It even shows your system’s internal and external IP addresses.
The gadget can show you data about a wireless or wired connection as well as the network interface card in use. It’s a great first step in troubleshooting a faulty Web connection, helping you pinpoint where to start: the router, the broadband connection or inside the PC.
You can adjust the gadget’s size, color scheme and how often it gets new data. At any time you can refresh the local or external IP address, which in itself can save a minute or two of clicking. There’s also a link to SpeedTest.net to check your online bandwidth.
Inspector Gadgets
DC Wireless Network Monitor
DC Wireless Network Monitor gadget![]()
DC Wireless Network Monitor shows just the basics about your Wi-Fi status.
The DC Wireless Network Monitor gadget, on the other hand, shows only the Wi-Fi basics in a tiny rectangle that takes up almost no room on your desktop. Below the main signal strength bar is the name of the network you’re connected to as well as the system’s IP address and a padlock symbol if it’s an encrypted link.
And that’s about it, except for the ability to change the color of the gadget. It’s ideal for minimalists who just want to keep an eye on their wireless connection.
Download DC Wireless Network Monitor (42KB)
Disk space and usage
O&O DiskStat
Wondering how much space you have left on your hard drive or whether your drive is working too hard or overheating? O&O DiskStat brings that info and more to your desktop.
O&O DiskStat gadget
O&O DiskStat’s default display is shown at right. Click it and the second screen (left) slides out with more information.
By default, the gadget shows two circular gauges: One is a pie chart of drive capacity and availability, and the other shows the drive’s activity level. When the drive is idle, it shows 0%; when it’s maxed out, it shows 100%.
If the S.M.A.R.T. drive-monitoring technology is enabled on your system, DiskStat shows the hard drive’s temperature below the gauges. You may be able to enable S.M.A.R.T. in your system’s BIOS or use a utility like Ariolic’s ActiveSMART ($30), which doesn’t require a system restart to work.
Click on any part of the DiskStat gadget and it doubles in size, revealing a new section with more details about the drive, including its size and free space.
O&O DiskStat can look at only one drive or disk partition at a time; you choose which drive to monitor in the setup screen. Click on the monkey wrench icon on the right side to get to it.
Of all the gadgets I’ve seen, O&O DiskStat is the best looking; it displays the right amount of information without seeming cramped. There are two skins that can help this gadget fit into your desktop decor, and you can remove the O&O logo for a minimalist approach. You can’t adjust its size, but the gadget lets you choose whether you want the temperature displayed in Celsius or Fahrenheit.
Drive Meter gadget
Drive Meter can track disk activity for multiple drives.
Drive Meter
Those who have multiple hard drives or multiple disk partitions on a single drive should consider running Drive Meter as well. It shows how much data is going into and coming out of each drive as well as its percent utilization.
It doesn’t watch the drives’ temperature or show you how much space is available, but it provides a good way to keep an eye on disk activity for up to three drives or partitions simultaneously.
Download Drive Meter (33KB)
An eye on graphics
GPU Monitor gadget
GPU Monitor keeps an eye on your graphics subsystem.
GPU Monitor
Unlike general system gadgets, GPU Monitor cares about just one thing: your graphics processing unit and how well it is running. A fount of information about your system’s graphics and video, this gadget can help pinpoint problems whether you have a budget PC with integrated graphics or a high-end system with a discrete GPU.
In addition to showing which accelerator chip your system uses and key stats such as video memory used and graphics processor load, GPU Monitor shows the chip’s and graphics board’s temperatures. You can have the gadget warn you with an audio alarm if the graphics subsystem starts overheating, although it can’t initiate a system shutdown to prevent damage.
For those experiencing intermittent problems with video, GPU Monitor can keep a log file containing info on any of five main graphics parameters, such GPU temperature and if the fan is on, along with time stamps to help troubleshoot the issue.
GPU Monitor presents a lot of data and can seem crowded, but you can customize it by limiting the types of data it shows, showing data in separate graphs or a single one, and changing the gadget’s size and color combination.
Note: Some users with integrated graphics systems might need to load the RivaTuner software, which collects the data that GPU Monitor shows. It’s free, and you can download it from within the gadget.
Download GPU Monitor (1.2MB)
Firewall status check
Windows Firewall Profile
Buried inside the Windows Firewall settings page (accessible via the Control Panel) is the ability to set your firewall profile as Public (for unsecure networks, like café hot spots) or Private (for your secure home or business network). Each profile involves a different mixture of which incoming connections are allowed or blocked.
When connecting a laptop from the road, many travelers move around between secure private connections and public hot spots several times a day. But changing your computer’s firewall settings for public or private connections each time you switch networks is a tedious task, and one that’s easy to forget. The Windows Firewall Profile gadget assures you that you’ve made the change properly.
Windows Firewall Profile gadget
Is your Windows firewall profile set to Private or Public? Windows Firewall Profile knows.
One of the most basic gadgets around, Windows Firewall Profile doesn’t actually help you change your profile setting; it just shows you the current status (Private or Public) in a small black rectangle. Its size can’t be adjusted, and there isn’t much to configure either, aside from how frequently the system’s firewall status is checked (from 10 seconds to 5 minutes).
But what this gadget does, it does well. It immediately figured out when I changed my firewall profile from Private to Public settings and back again during a busy road trip.
Ideally, the gadget would provide a way to adjust the firewall settings or at least link to the firewall settings dialog. All the same, it’s reassuring to see what the firewall status is at a glance, without having to wade into the system settings to check.
Windows Firewall Profile (119KB)
Juice meter
9-skin Battery Meter
When you’re on the road and far from an AC outlet, it’s important to know how much power is left in your notebook’s battery. Windows 7 includes a battery gauge in the taskbar tray, but it stays hidden during most use; you have to click on it to see the charge level.
9-skin Battery Meter gadget
Keep an eye your laptop’s battery level with 9-skin Battery Meter.
That’s where 9-skin Battery Meter comes in. It does an excellent job of putting your battery level in your face in an artistic way.
The gadget comes with nine different decorative skins (hence the name) that range from a circular gauge to something that looks like an AA battery. You can either open the gadget’s Options to select one or give the gadget a double-click to bring up a new one.
The gadget glows green when the system is charging, and most of the battery gauge designs have eight elements that change color to show that the cells are running down. All turn to orange and then red for the last two segments; some add a triangular caution sign as the end nears.
Unlike many other gadgets, 9-skin Battery Meter can’t be resized, although you can choose whether to have the gadget display how much time remains before the system dies.
Download 9-skin Battery Meter (1.89MB)
Brand-specific gadgets
While the focus of this story is on gadgets that everyone can use to get some insight into how their system is working, I’ve also included two great gadgets that require specific hardware or software to work: the gadget that’s included with Symantec’s Norton Internet Security software and the Intel Core Series gadget for looking at certain Intel processors.
Norton Internet Security gadget
Symantec’s Norton gadget is among the most colorful. When the software is up to date and Internet bad guys are kept at bay, there’s a prominent green banner across the top of the gadget that says “Secure.” You’ll immediately know that something is amiss if, for instance, your version of the software is out of date, because the banner turns red and says “At Risk.”
Below the banner are icons that lead to the four major elements of the security suite. You can see details about the system’s current security status, discover what other members of your family have been doing online (the software keeps tabs on other computers on your network that share your Norton Internet Security license), check if your backups are up to date and find out if a website is safe before clicking to it.
Norton Internet Security gadget
The Norton gadget (inset) ties directly into the Norton Internet Security software.
There’s no download link for the Norton gadget: The only way to get it is to buy Norton Internet Security (regularly $70; now on sale for $50).
Intel Core Series
By contrast, the Core Series gadget is available online and can tell you a lot about your system’s processor — but only if it’s a recent Intel CPU.
The gadget wasn’t written by Intel, but it does a great job of interrogating Intel processors. (AMD has a similar system monitoring program, but it’s a full Windows 7 application, not a gadget.)
Intel Core Series gadget
The Core Series gadget shows a wealth of information about recent Intel CPUs.
Like System Control A1, the Core Series gadget monitors up to eight processing threads (rather than cores, as it says), but it’s valuable information nonetheless. It adds a handy overall CPU Usage rating and a graph below. If you add the WinRing0 software, which Core Series can download for you, the gadget can display the chip’s actual clock speed as well.
You can choose a color scheme for the gadget and tell it what to include in the graph along the bottom: individual threads, all the operating threads, core temperature, or temperature and threads together. You can’t resize it, though, which is a problem because the graph is rather crowded.
Download Intel Core Series (169KB)

Best Microsoft MCTS Certification, Microsoft MCITP Training at certkingdom.com
No description.Please update your profile.
@ 2016 Certkingdom.com-Developed By Certkingdom.com